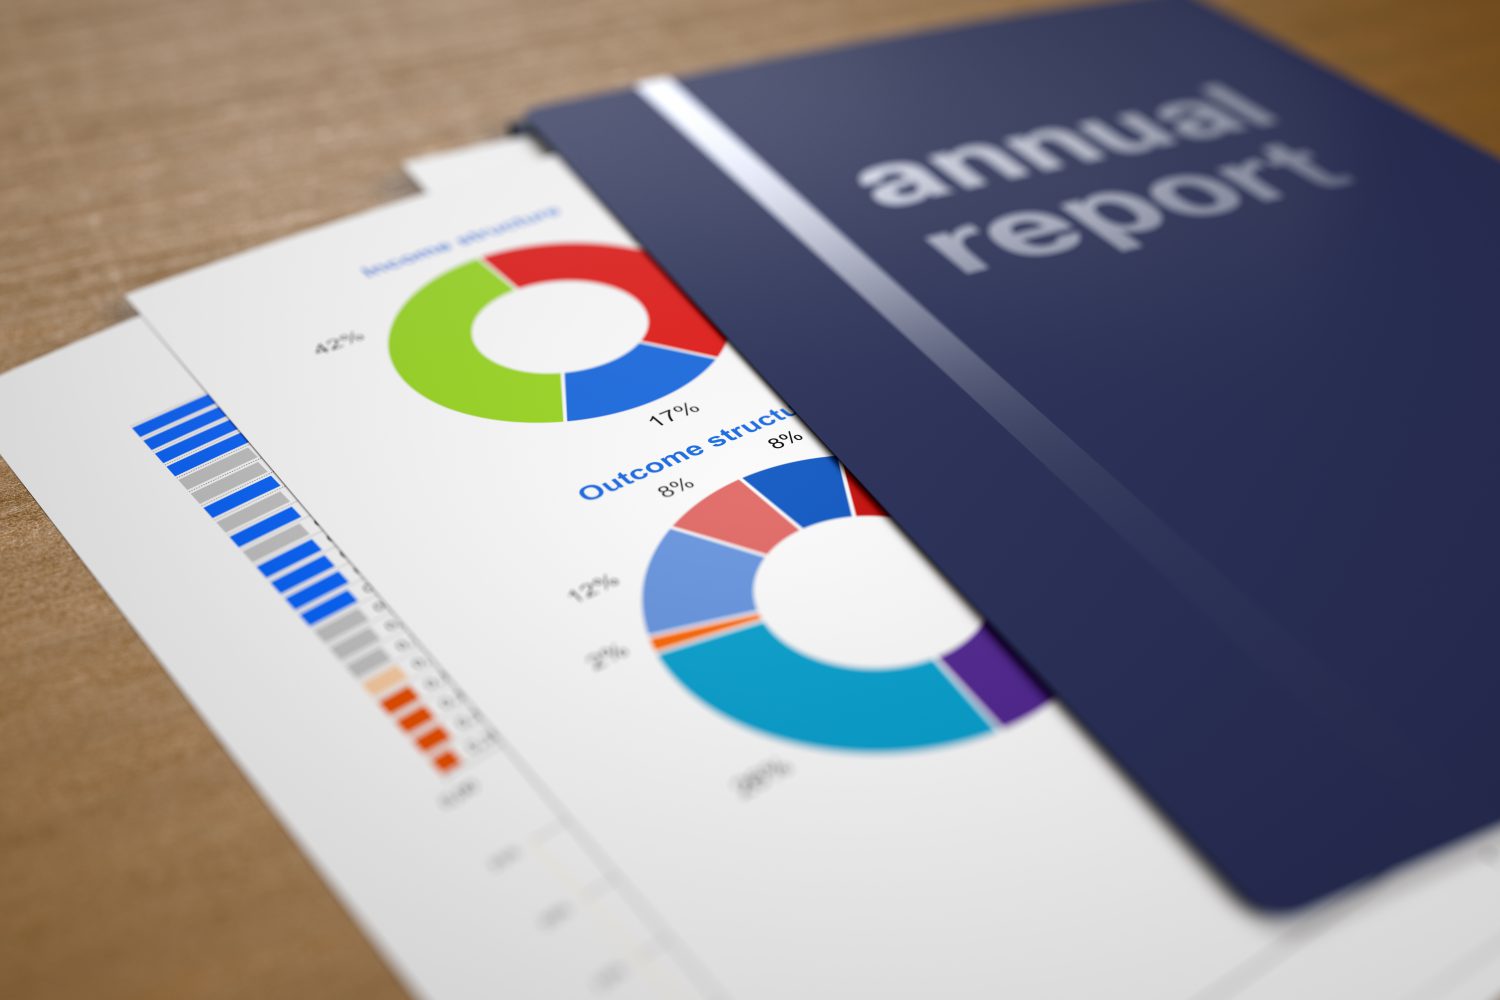
 In a previous Blog post I mentioned that I had a strange obsession with Museum Annual Reports. I enjoy browsing through them to get a sense of what makes a good and bad annual report. If I was to write this blog now I would add another “tip” to what makes a great report. I would add the importance of adding an “Economic Impact Statement”. These statements are becoming increasingly important. As local civic “bean counters” casually ask “what purpose does the local museum serve anyways”, It’s important that museum staff have this information at the ready. Too often this information is buried in a financial ledger somewhere in the annual report, bewildering museum members. The American Alliance of Museums suggests answering four questions in a clear and concise Economic Impact Statement:
-
- My museum employs _____ (#) people in our community.
- My museum spends $____ annual budget each year on goods and services in our community.
- My museum serves _____ (#) visitors each year, including % from out of town.
- My museum serves _____ (#) schoolchildren each year through school visits to museums.
The Association Alliance of Museums also provides a sample of infographics best used in displaying Economic Impact data.
One of the key metrics that museums usually use as part of their Economic Impact Statement is visitor numbers. Unfortunately, they often get this critical metric notoriously wrong. It’s true that most museums keep accurate numbers of people walking through their doors, however they tend to stop with just that. They rarely collect demographics on visitors. The most critical demographic collected from your visitors should be: “where do you live”? If you can display that many of your visitors come from out of town, it has a direct impact on Hotels, Restaurants, and related services in your community. This should then be a key indicator on your annual report. Not to mention, this information is also critical to future marketing campaigns.
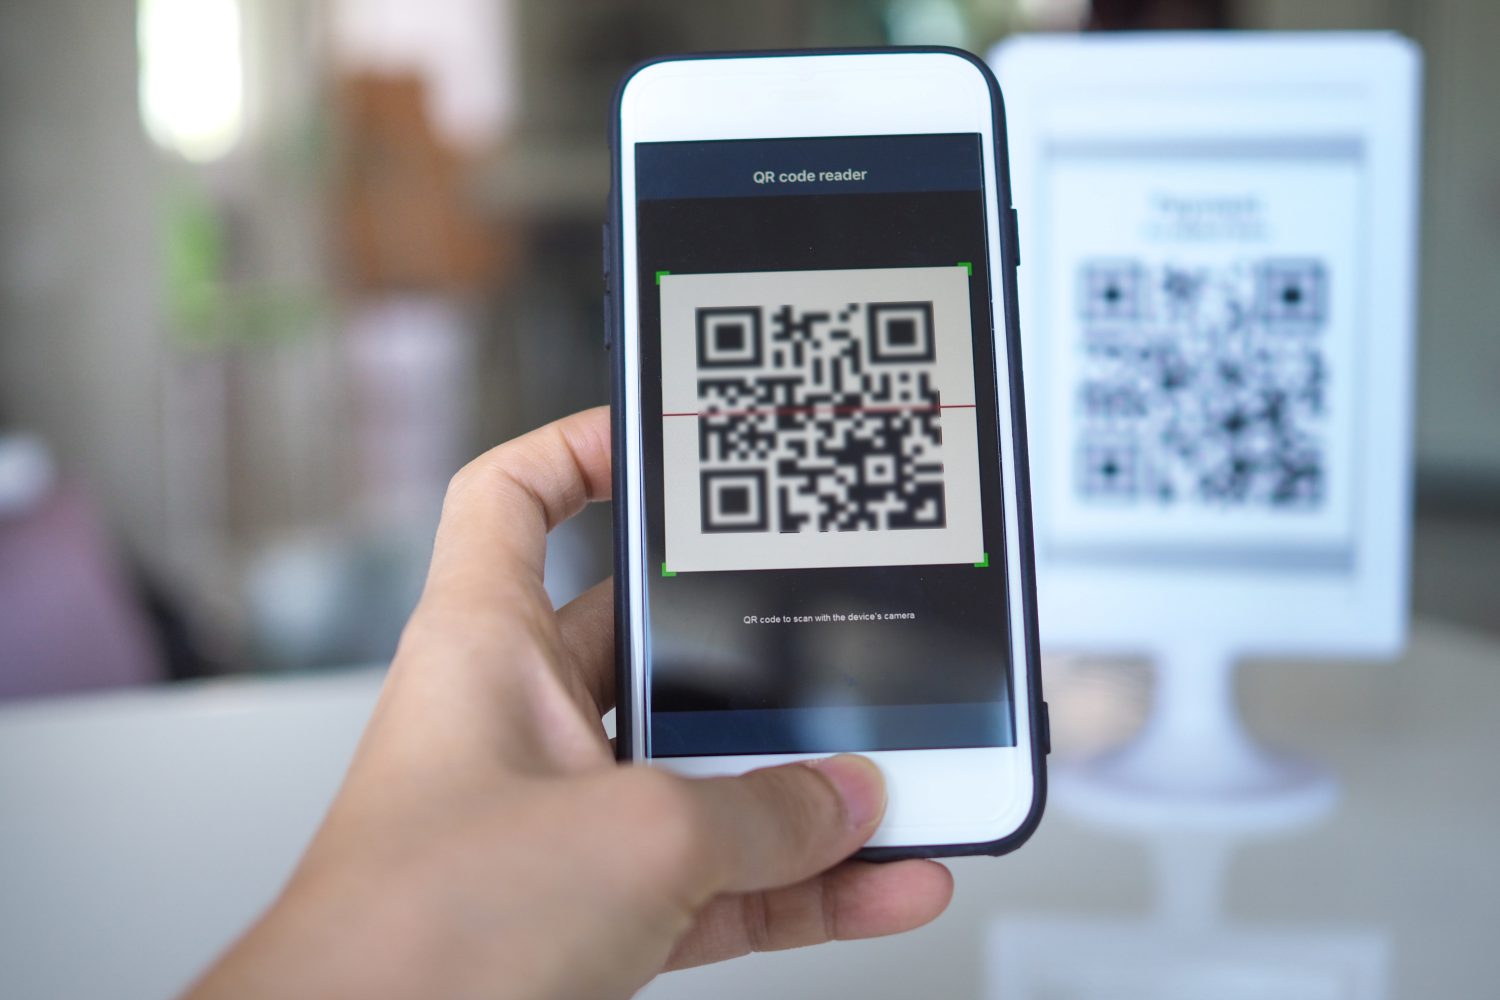
 Technology is making this type data gathering much easier. Gone are the days when it took considerable staff time to ask visitors for demographic information. One of the methods to gather information that I would recommend is the use of QR codes. It is now easy to display a QR Code in your museum on a sign that says “Please Help us Out by Answering a Few Questions”. Your guest can then use their smart phone to scan the QR code and quickly answer your demographic survey. Hint: please make certain your survey is really just a few questions! Notoriously long surveys are often abandoned by participants. You will find that if the survey is short and concise, visitors will be more than willing to provide their demographic information. There are several relatively inexpensive online services that can help you with this and Google is much better at helping you to locate them than I am.
One other recommendation I would make to museums (and really any public institution) is that if visitor information is something that you are struggling with, then please consider joining the “Visitors Studies Association”. This is an excellent association that focuses on all facets of the visitor experience in museums, zoos, nature centers, visitor centers, historic sites, parks and other informal learning settings. A large portion of its mandate focuses on the subject of data reporting and analytics of the visitor experience. It also holds an Annual Conference and publishes an excellent Journal.
Collecting demographic numbers from visitors can be a pain, especially when there is so much else to do in the museum. However, these simple demographics could lead to your survival when the “bean counters” come calling!
Thank you for reading our Blog Post! This review was written with the assistance of “Grammarly”. Grammarly is an amazing FREE tool that allows anyone to write like a professional! For more information and a free download, click here.
For our Reviews of excellent books on Natural History, Archaeology and Technology, please visit our main website!
